Unlock performance and behavior insights
Combine data to analyze content engagement, viewer patterns, ad performance, and risk — all through SQL queries powered by Coactive’s Dynamic Tags and Concepts.


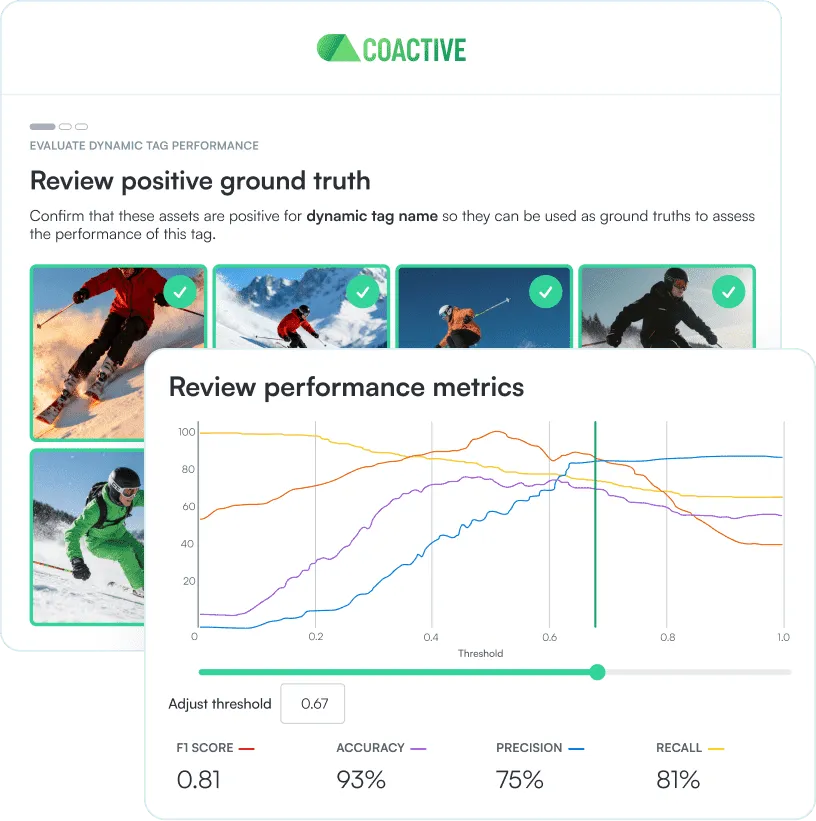
Coactive’s SQL analysis capabilities let teams query, filter, and evaluate large-scale visual datasets—enabling precise, programmatic insights across content performance, behavior, and risk.


Combine data to analyze content engagement, viewer patterns, ad performance, and risk — all through SQL queries powered by Coactive’s Dynamic Tags and Concepts.

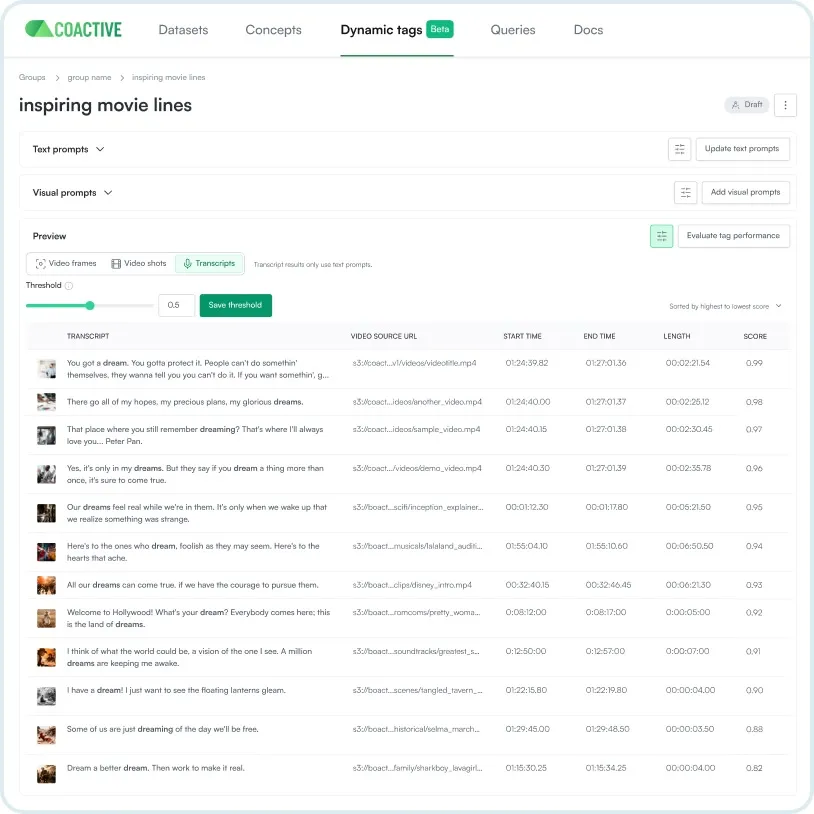
Filter and combine transcript, visual, and audio signals to uncover deeper trends across content libraries.

Send structured outputs (e.g., raw tag scores, probabilities) to S3 or CSV. These exports can be easily loaded into Python, R, or PySpark for experiments, scoring, and fine-tuning.
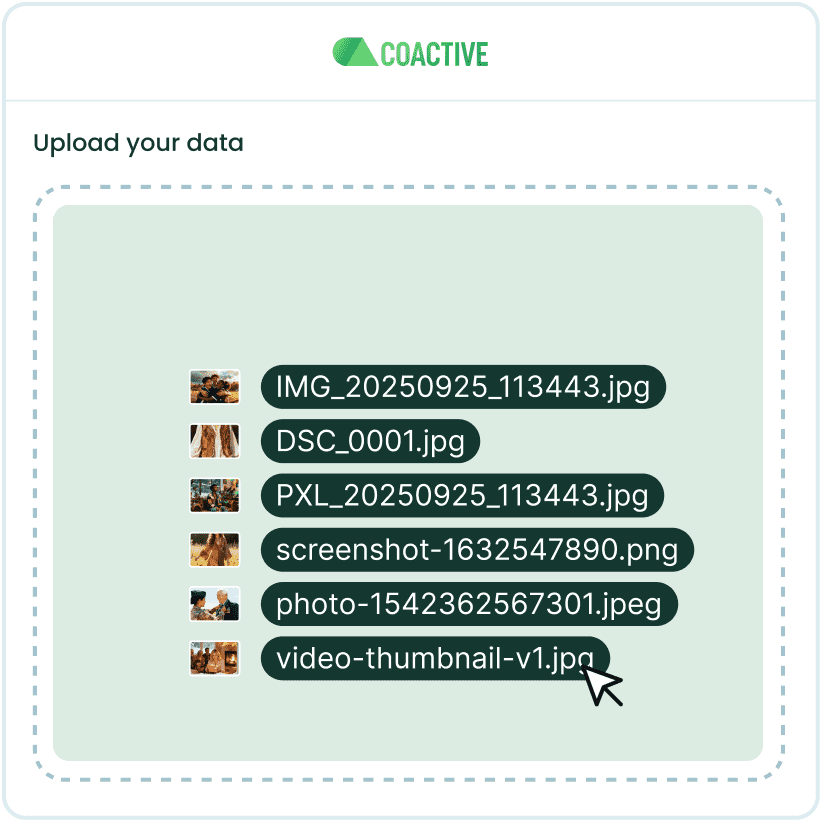


Transform unstructured visual data into actionable analytics through SQL queries.

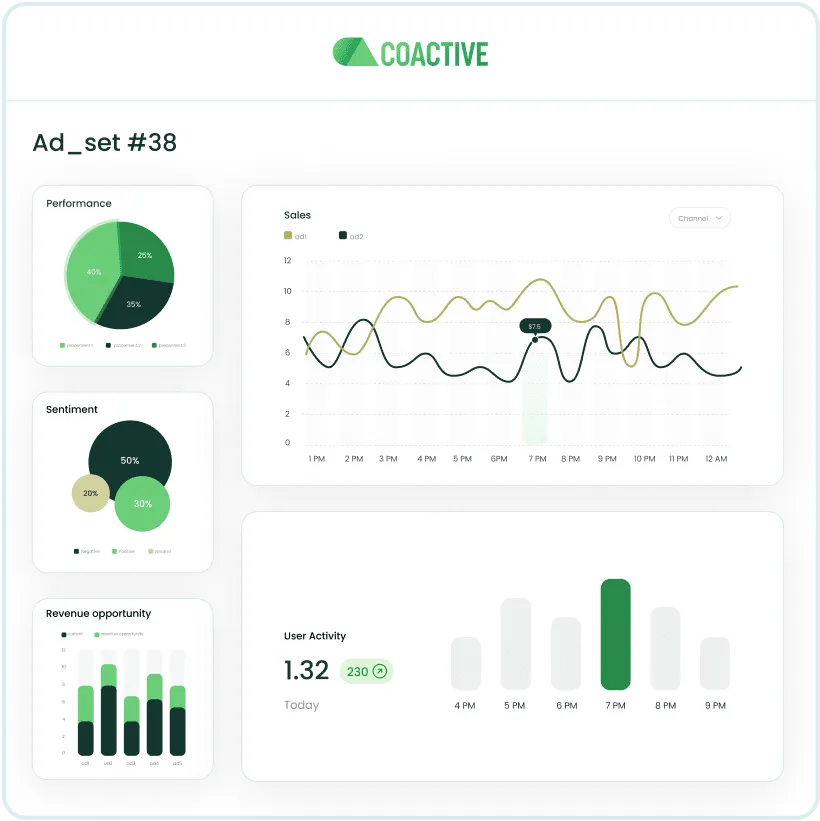
Compare and analyze metadata from custom classifications (powered by Coactive) with ad data to understand which creative or content types perform best.

Aggregate data via APIs across multiple storage systems and generate optimized, cross-database queries.

Easily push Coactive data into warehouses or data lakes (e.g., Delta Lake) and analyze it alongside key performance metrics in your existing BI stack.
Gain powerful insights by blending Coactive data and metadata with your ratings, ad, audience, or other data.

Measure audience retention on Olympic highlights vs. scripted drama, or compare drop-off between live and on-demand shows.

Track how viewers engage differently with sports, news, and entertainment across platforms.

Compare campaign performance across sports vs. entertainment programming, to see where ads drive the most lift.

Flag high-risk content segments — from inappropriate moments in children’s shows to sensitive issues in live broadcasts.


Quickly remove profanity, violence, or other sensitive content across millions of clips with a single query.

Aggregate ratings data with content metadata to identify which storylines, scenes, or ad placements drive audience spikes or drops.

Analyze ad performance across different genres and time slots to refine targeting and scheduling.

Export clean, structured outputs into S3, Python, R, or PySpark for advanced modeling, testing, or audience analysis.


Download probability and score data to external tools like PySpark or Excel to test thresholds and validate results.

For example, compare cut-sheet performance data across networks or campaigns to identify which content drives higher ratings, engagement, or ad effectiveness.

Use raw tag score data in Python or R to experiment with new models, evaluate promo effectiveness across genres, or test metadata thresholds for trust and safety.
Coactive automatically generates additional metadata on the backend that becomes accessible via SQL queries for calculated evaluations.